
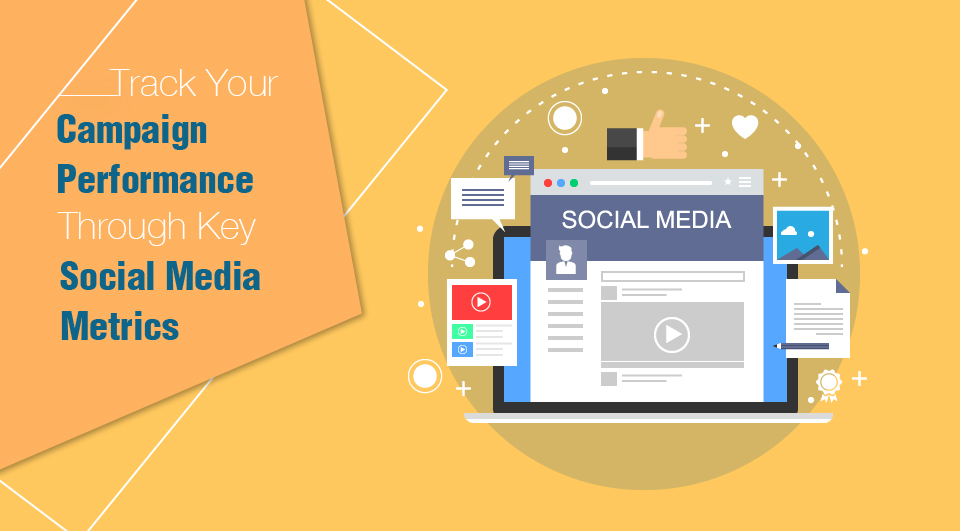
Track Your Campaign Performance Through Key Social Media Metrics
Academic institutions generally have conservative marketing budgets. Therefore, advertising ROI has to be more accountable. Through social media metrics it is now possible to monitor, measure and boost your advertising bottom lines. Social media analytics helps to provide sharper customer insights with scientific audience research tools for increasing institutional outreach through enhanced social media engagement.
But how do we do it is the key to achieving better results.
Too many Institutes usually fall back on standard metrics mechanism for tracking campaign performance. Definitely, acquiring new follower base, high number of likes and shares etc. do provide useful campaign insights but more crucial is the fact that how this information is being processed and interpreted for measuring success.
Perhaps, data has to be analyzed, interpreted and understood in the right context then only it can be taken to the next level to reflect campaign effectiveness. In context of academic institutions, mostly social media is used either to generate leads for driving admissions or running campaigns for increasing website traffic.
Here are 4 suggestive tools for understanding social media analytics to develop more effective campaign strategy.
- Click Through Rate (CTR)
CTR is a key indicator of the impact of your social media messaging. Low CTR is an indicator for making your content stickier and relevant so that it kindles audience interest. Tracking CTRs becomes more useful when these clicks are linked with website bounce rate. It essentially shows the percentage of page visitors who leave your website immediately after landing on a web page. This could mean that due to lack of interesting and relevant content the visitor got disengaged quickly. High bounce rate is not a healthy indicator of your website performance. Perhaps it’s time to restructure the website content.
- Social Referral Traffic
How to track this? You would need to set up Google Analytics account for this.
Track number of visitors who come from your social networks (Facebook, Twitter, LinkedIn, YouTube etc.) and paid advertising campaigns on Google or social media properties. Compare their percentage contribution to the overall traffic generated through various channels. Higher social media traffic with low bounce rate than other sources shows that you are attracting the right people through this channel. The metrics provides insights on web referrals and share of overall traffic. The area to focus here is share of traffic by social which is more important than just amount of traffic generated. Accordingly you can rank these platforms based on number of sessions they drive in meeting the desired campaign goals.
- Facebook Competitor Analytics
You can map performance of your social media engagement with that of your competitors through Facebook insights. Facebook insights tool allows you to compare the performance of your Page and posts with similar Pages on Facebook under ‘Pages to Watch’ section. It generates comparative performance matrix upto five institutions. This is helpful in identifying engagement rate, reach etc. of your posts. If you rank high on the list then your social campaigns on Facebook are justified. The metrics proves that your efforts and budget spent on the most popular social platform is giving you social mileage against your competitors.
- Track Leads Till End of Admission Cycle
The concept of leads is a successful benchmark of your advertising return on investment. Ultimately it is the final admission numbers that will drive your educational enterprise forward. Generating measurable leads through social media can help increase the initial pool of applications that can further increase funnel size for filling of seats in the end. These leads can easily be matched with the admission database of applicants at regular stages of the selection process to get conversion rate. So, essentially how many applications were filled by the leads, then how many were called for interview process and finally how many accepted the admission offer. We can also move one step ahead and calculate the final number staying back after withdrawals. In this way, we can track the complete conversion cycle of the leads campaign.
Although the above mentioned ways are not exhaustive, however, they can provide a road map to start with. Keep following this space for more such interesting insights on using social media analytics to drive admissions and increasing overall awareness about your educational brand surpassing your competitors.